How to Manage Your VPS – Usage/Graphs/Notifications
Contents
You can manage your VPS easily through the Packetra client portal. In this guide, we will walk you through where you can view your vps usage (ram/cpu etc) as well as create a notification.
This article is only applicable to those who have an account with Packetra and it assumes that you are already logged into the portal. Don’t have a VPS yet? Check out our CloudVPS Plans. If you already have one feel free to login to follow the guide below
Navigate to your VPS Service
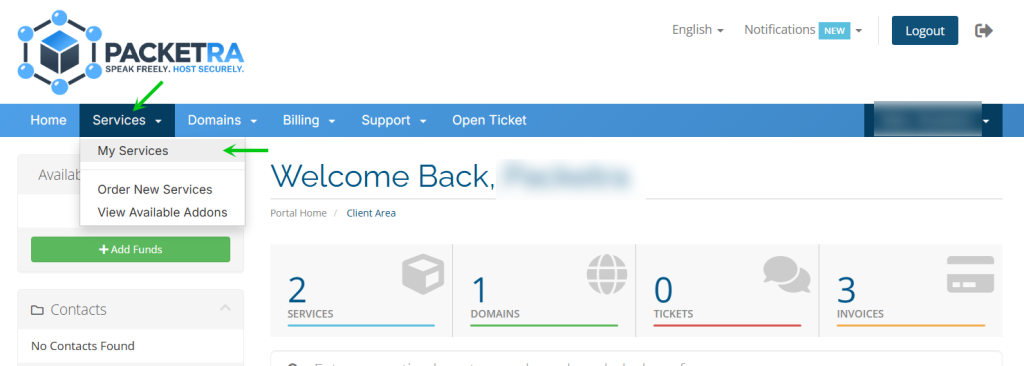
First click the Services tab in the top navigation, then select My Services from the dropdown menu.
Select the VPS you wish to review the usage on
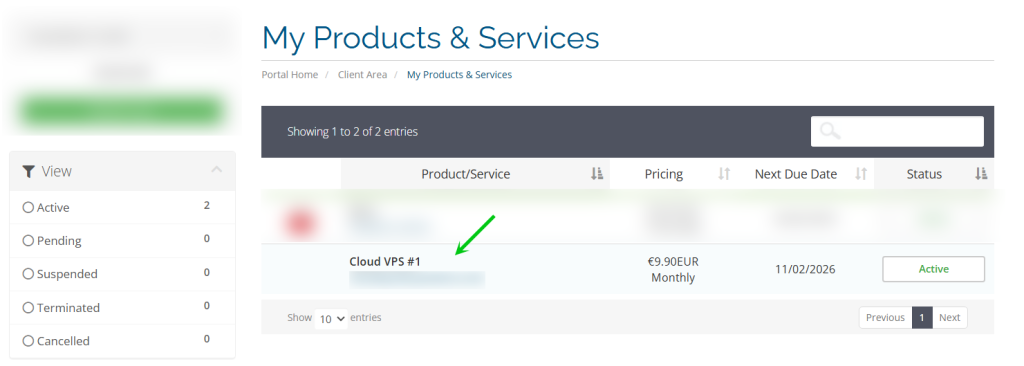
Next, find the active vps you wish to view the resources on in the My Products & Services and click on it to open the service details page.
See the VPS Usage
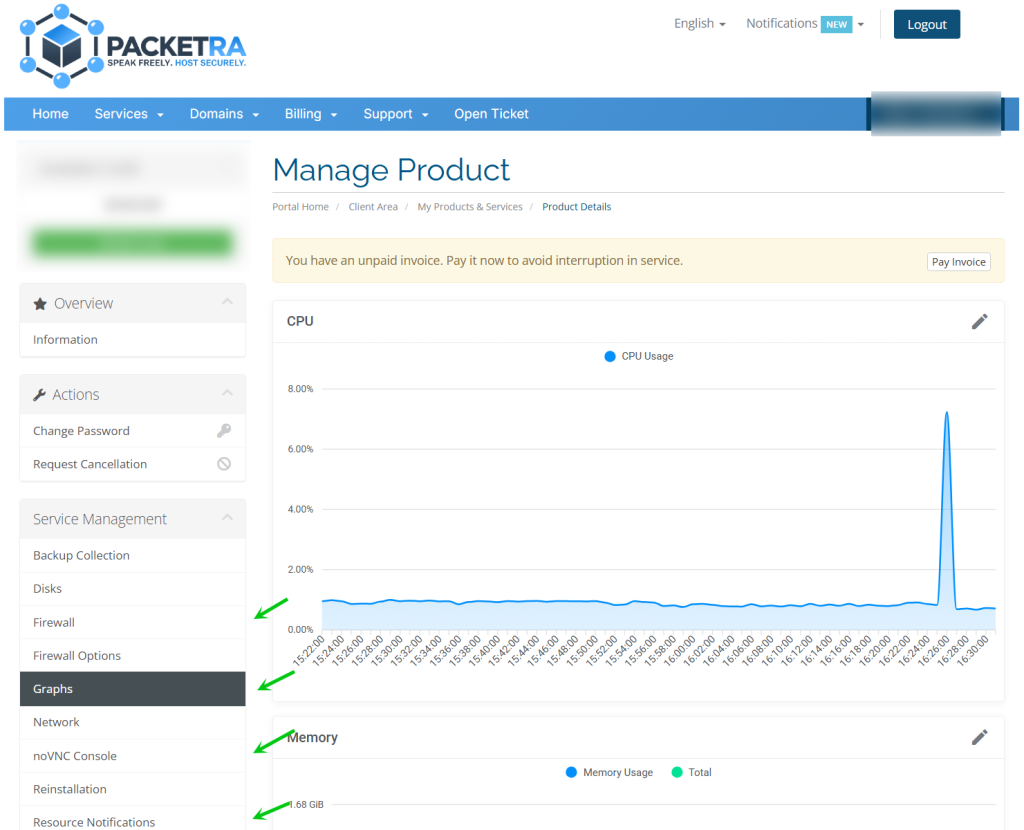
Next, click the Graphs to view the usage of your CPU/Memory/Network Data & Disk IO
See VPU Usage Resource Notification
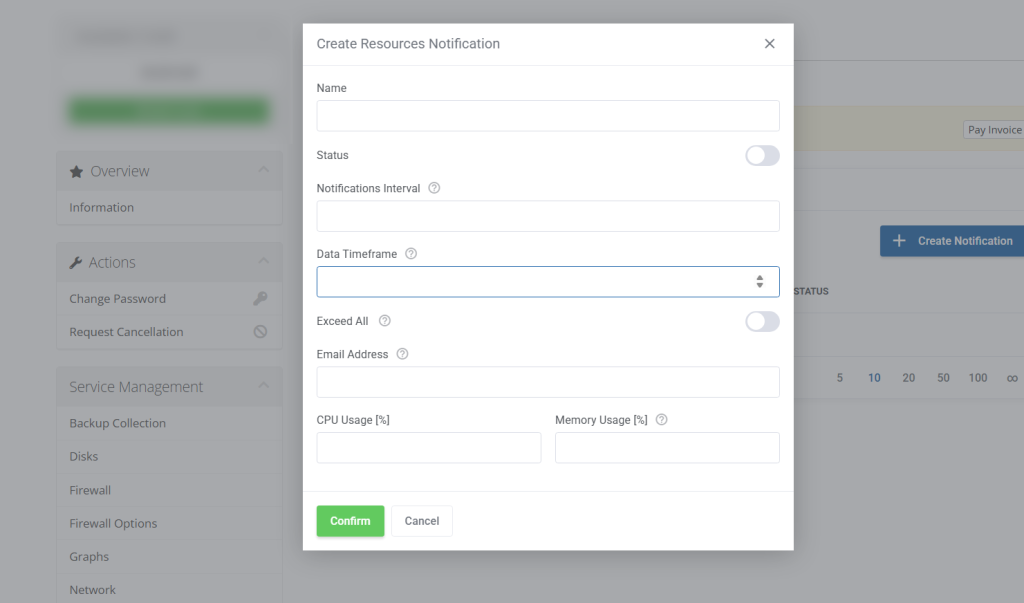
Next, You can add a notification to be alerted if your server reaches certain threshold by clicking the Resource Notification as shown with the green arrow above in the screenshot. Once you are on the page, you can click +Create Notification and set the notification to your liking. Whatever resource and timeframe you wish to set, you do so here on the screenshot below.
Frequently Asked Questions
How often are the graphs updated? The resource graphs update in near real-time. However, there may be a slight delay of a few minutes depending on server load.
Will I receive notifications by email? Yes, once you set up a resource notification, alerts will be sent to the email address associated with your account.
What should I do if my CPU or RAM is consistently high? If your VPS is regularly hitting its resource limits, it may be time to consider upgrading to a higher plan. Check out our CloudVPSplans for options or open a support ticket and we can advise you.
Good to Know Resource notifications are a great way to stay on top of your server health without having to manually check the graphs. Additionally, setting a notification threshold at around 80% gives you time to react before your server becomes unresponsive. If you have any issues with your service, open a support ticket through the client portal and our team will assist you.